nPower Scheduler™ 1.2.0 Teaser: Introducing the nPower Dashboard
We’re excited to share a sneak peek of nPower Scheduler™ 1.2.0, featuring the all-new nPower Dashboard! This release is packed with powerful Key Performance Indicators (KPIs) designed to give operations managers the insights they need to streamline production, meet delivery commitments, and optimize resource utilization.
- Production Schedule KPI
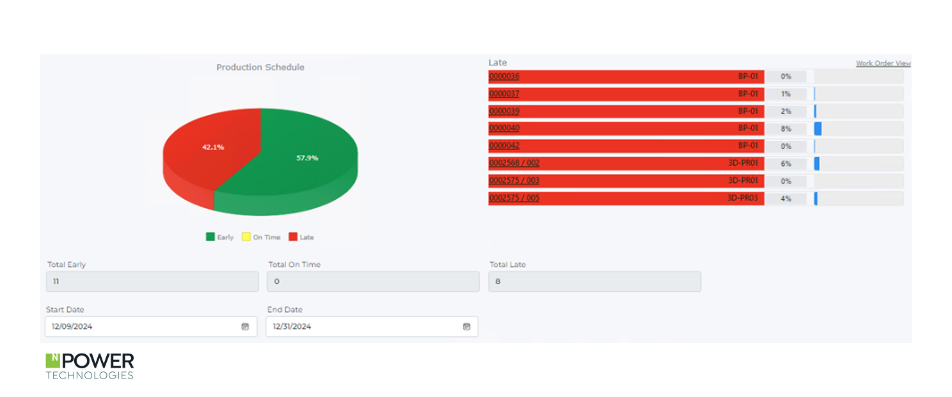
One of the first questions an operations manager asks: “Is my production supporting delivery obligations?”
The Production Schedule KPI delivers a clear snapshot of Early, On-Time, and Late production in a pie chart format, filtered over your chosen date range.
- Click on a parameter, such as Late Orders, to instantly drill into a list of affected orders and their progress.
- From there, you can jump directly to the nPower Work Order View for detailed insights on any specific order.
This KPI ensures you can identify and address scheduling issues before they impact your bottom line.

- Scheduled Throughput KPI
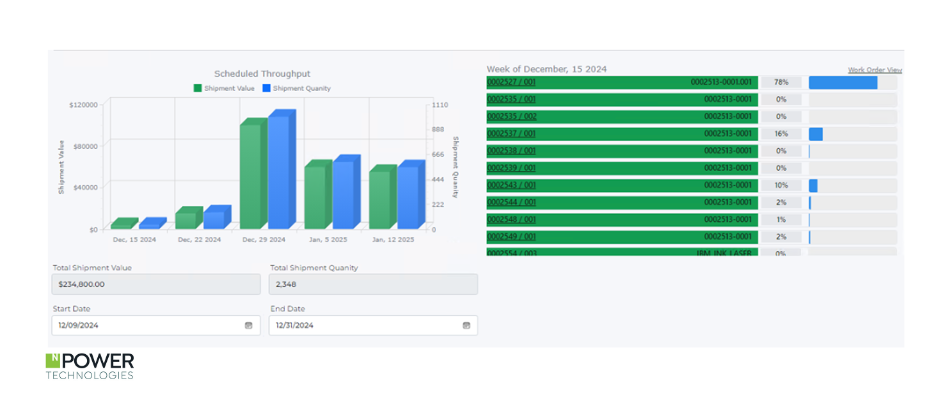
Need to know how much you’re shipping today, this week, or by month-end? The Scheduled Throughput KPI has you covered.
- This double-axis bar chart shows scheduled-to-finish quantities and dollar values for a selected timeframe.
- Drill down into the data to identify the orders driving your shippable dollars.
- Spot opportunities to pull in orders early to help meet invoicing goals and drive revenue faster.
This metric provides critical visibility into your output, keeping your production aligned with financial objectives.

- Work Center Utilization KPI
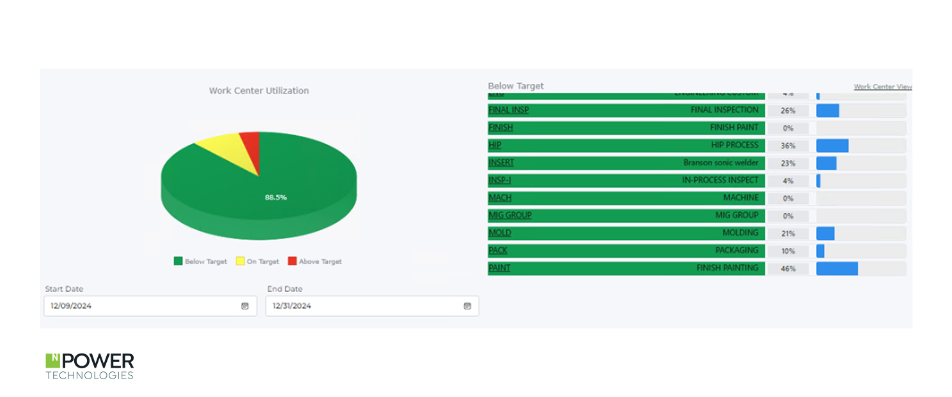
Resource management is key to maintaining smooth operations. The Work Center Utilization KPI helps you monitor resource performance with a breakdown of:
- Below Target
- At Target
- Above Target
By analyzing this KPI, you can:
- Pinpoint underutilized or overburdened resources.
- Identify bottlenecks where reallocation or cross-training can improve efficiency.
- Drill into specific work centers to achieve greater level loading across production.
This powerful tool gives you the insights needed to optimize resources and eliminate production slowdowns.

Stay Ahead with nPower Scheduler™ 1.2.0
The nPower Dashboard brings these KPIs to your fingertips, delivering a clear, actionable view of the key drivers for success. Release 1.2.0 is designed to transform the way you manage production, ensuring you have the tools to stay ahead of challenges and maximize efficiency.
Keep an eye out in the coming weeks for the official release announcement and more details. At nPower Technologies, we’re committed to delivering cutting-edge tools that empower your manufacturing operations to stay ahead of the curve.
For updates, visit npowertech.com.
#ManufacturingInnovation #nPowerScheduler #AdditiveManufacturing #KPIs #ProductionEfficiency


